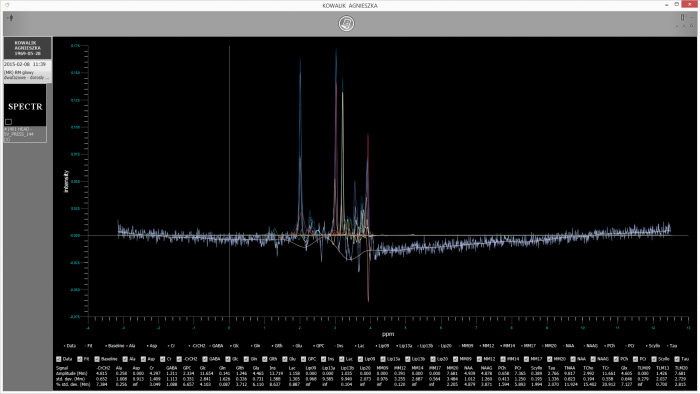
Exhibeon allows for evaluating the concentration of selected compounds in the studied organ.
In the spectroscopy graph, it is possible to hide each compound so that the graph is easier to read.
Pacs, RIS, Radibox, Robo, Exhibeon
Contact us to get offer, service and support
Zgadzam się na przechowywanie na urządzeniu, z którego korzystam tzw. plików cookies oraz na przetwarzanie moich danych osobowych pozostawionych w związku z korzystaniem przez ze mnie ze strony internetowej oraz produktów i usług świadczonych drogą elektroniczną, w tym także informacji oraz innych parametrów zapisywanych w plikach cookies w celach marketingowych, w tym na profilowanie* przez Pixel Technology sp. z o. o. z siedzibą w Łodzi. Ta strona internetowa wykorzystuje pliki cookies w celach statystycznych i reklamowych oraz w celu dostosowania się do Twoich potrzeb. Korzystanie ze strony internetowej oznacza, że akceptujesz otrzymywanie plików cookies. Jeżeli nie chcesz plików cookies, możesz zmienić ustawienia przeglądarki internetowej. Więcej informacji znajdziesz w Polityce prywatności. Mając na uwadze wymogi ustawy z dnia 18 lipca 2002 roku o świadczeniu usług drogą elektroniczną wyrażam zgodę na otrzymywanie od Pixel Technology sp. z o. o. z siedzibą w Łodzi drogą elektroniczną na wskazany przeze mnie adres e-mail informacji handlowych, dotyczącą produktów i usług oferowanych w celach marketingowych Mając na uwadze wymogi art. 172 ustawy z dnia 16 lipca 2004r. Prawo telekomunikacyjne wyrażam zgodę na przesyłanie mi ofert przez Pixel Technology sp. z o. o. z siedzibą w Łodzi w celach marketingowych, dotyczących produktów i usług wykonywane przy użyciu telekomunikacyjnych urządzeń końcowych oraz automatycznych systemów wywołujących.
The cookie settings on this website are set to "allow cookies" to give you the best browsing experience possible. If you continue to use this website without changing your cookie settings or you click "Accept" below then you are consenting to this.